PythonライブラリのAxelrodで実行するシミュレーション③(Visualising results)|ゲーム理論について #7

ゲーム理論に関するシリーズとして、諸々取り扱っています。
#1〜#4ではWikipediaの内容を元にゲーム理論の大枠について抑えました。
#1では大まかな枠組みについて、#2、#3ではゲーム理論の研究史について、#4ではゲーム理論の応用分野について取り扱いました。
ゲーム理論の概論①(大まかな枠組み)|ゲーム理論について #1 - lib-arts’s diary
ゲーム理論の概論②(ゲーム理論の研究史1)|ゲーム理論について #2 - lib-arts’s diary
ゲーム理論の概論③(ゲーム理論の研究史2)|ゲーム理論について #3 - lib-arts’s diary
https://lib-arts.hatenablog.com/entry/game_theory4
#5からはゲーム理論のシミュレーション的な解法として一時期注目を集めたAxelrodの研究をPythonライブラリ化したAxelrodライブラリについて確認しています。
Welcome to the documentation for the Axelrod Python library — Axelrod 0.0.1 documentation
#6ではチュートリアルの全体像を確認した上で簡単な実行を行いました。
https://lib-arts.hatenablog.com/entry/game_theory6
#7ではチュートリアルより"Visualising results"の内容を取り扱います。
Visualising results — Axelrod 0.0.1 documentation
以下目次になります。
1. Summarising tournament results
2. Visualising results
2-1. Visualising the results of the tournament
2-2. Visualising the distributions of wins
2-3. Visualising the payoff matrix
2-4. Passing various objects to plot
3. まとめ
1. Summarising tournament results
1節ではtournamentの結果の要約を行います。早速下記を実行します。
import axelrod as axl
import pprint
players = [axl.Cooperator(), axl.Defector(),
axl.TitForTat(), axl.Grudger()]
tournament = axl.Tournament(players, turns=10, repetitions=3)
results = tournament.play()
summary = results.summarise()
pprint.pprint(summary)
print("====")
results.write_summary('summary.csv')
import csv
with open('summary.csv', 'r') as outfile:
csvreader = csv.reader(outfile)
for row in csvreader:
print(row)
実行結果は下記のようになります。


上記のように結果の出力などができています。
2. Visualising results
This tutorial will show you briefly how to visualise some basic results
『このチュートリアルではいくつかの基本的な結果についての可視化の方法について取り扱います』となっています。2-1〜2-4でそれぞれについて取り扱っていきます。
2-1. Visualising the results of the tournament
2-1節ではVisualising the results of the tournamentの内容について取り扱っていきます。

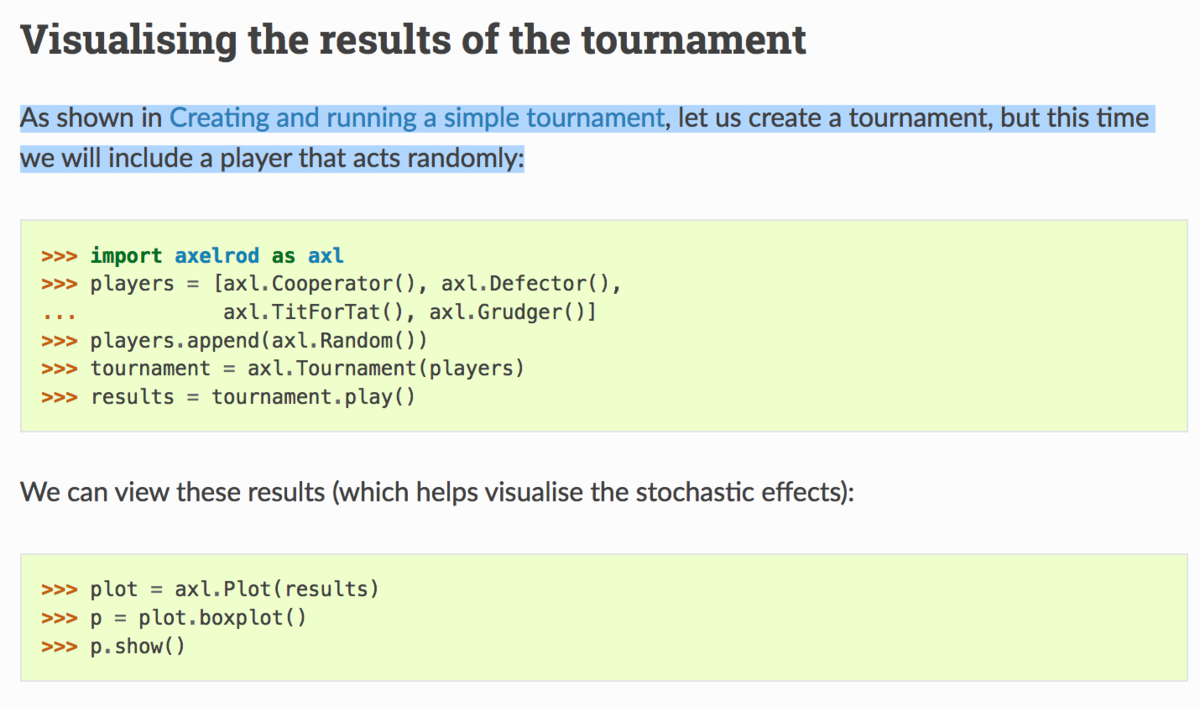
ここでは、"Creating and running a simple tournament"のところで取り扱ったtournamentの可視化について取り扱われています。下記で簡単に実行を行ってみます。
import axelrod as axl
players = [axl.Cooperator(), axl.Defector(),
axl.TitForTat(), axl.Grudger()]
players.append(axl.Random())
tournament = axl.Tournament(players)
results = tournament.play()plot = axl.Plot(results)
p = plot.boxplot()
p.show()
実行結果は下記のようになります。


基本的には#6で取り扱った内容と同様なのですが、ランダムのプレイヤーが追加されたり、単なるバーチャートでなくなったなどの点が異なっています。とはいえ描画自体はそれほど変わっておらず、描画にあたってはmatplotlibが用いられています。
2-2. Visualising the distributions of wins
2-2節ではVisualising the distributions of winsの内容について取り扱っていきます。
 ここでは、それぞれの戦略のwinsの分布を可視化しています。
2-3. Visualising the payoff matrix
2-3節ではVisualising the payoff matrixの内容について取り扱っていきます。

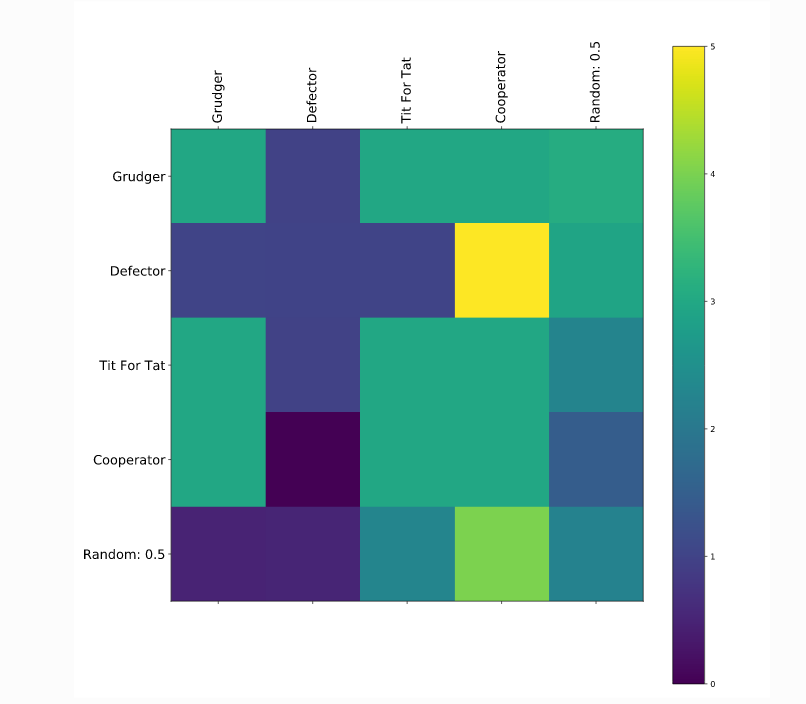
ここでは、payoff matrixの可視化について取り扱われています。このpayoff matrixは取り扱う戦略が数多い時に特に役立つとされています。上記では青->緑->黄色の色でそれぞれの戦略の得点について可視化されています。行->列について見た際に、行側が列側と対した際のスコアになっています。DefectorがCooperatorに対した際に一番獲得スコアが大きくなっていることが確認できます。DefectorがCooperatorに対した際に最大スコアになっていますが、一方で他の戦略と相対した際にスコアが伸び悩んでいたりするので必ずしも良い戦略ではないというのも読み取れます。
2-4. Passing various objects to plot

上記のようにタイトルやラベルを設定する方法について記載されています。
2. まとめ
#7ではチュートリアルより"Summarising tournament results"と"Visualising results"の内容を取り扱いました。
#8では"Moran Process"以降の内容について取り扱います。