Tutorialに学ぶseabornの使い方③(Visualizing the distribution of a dataset)|Pythonによる可視化入門 #7

連載の経緯は#1をご確認ください。
#1〜#4まではMatplotlibに関して、#5はseabornチュートリアルの"Visualizing statistical relationships"、#6では"Plotting with categorical data"を元に使い方についてまとめました。
#7では#5、#6に引き続きseabornのチュートリアルから"Visualizing the distribution of a dataset"について取り扱います。
以下目次になります。
1. Visualizing the distribution of a datasetについて
1-1. Plotting univariate distributions
1-2. Plotting bivariate distributions
1-3. Visualizing pairwise relationships in a dataset
2. まとめ
1. Visualizing the distribution of a datasetについて
1節ではチュートリアルの"Visualizing the distribution of a dataset"について取り扱っていきます。
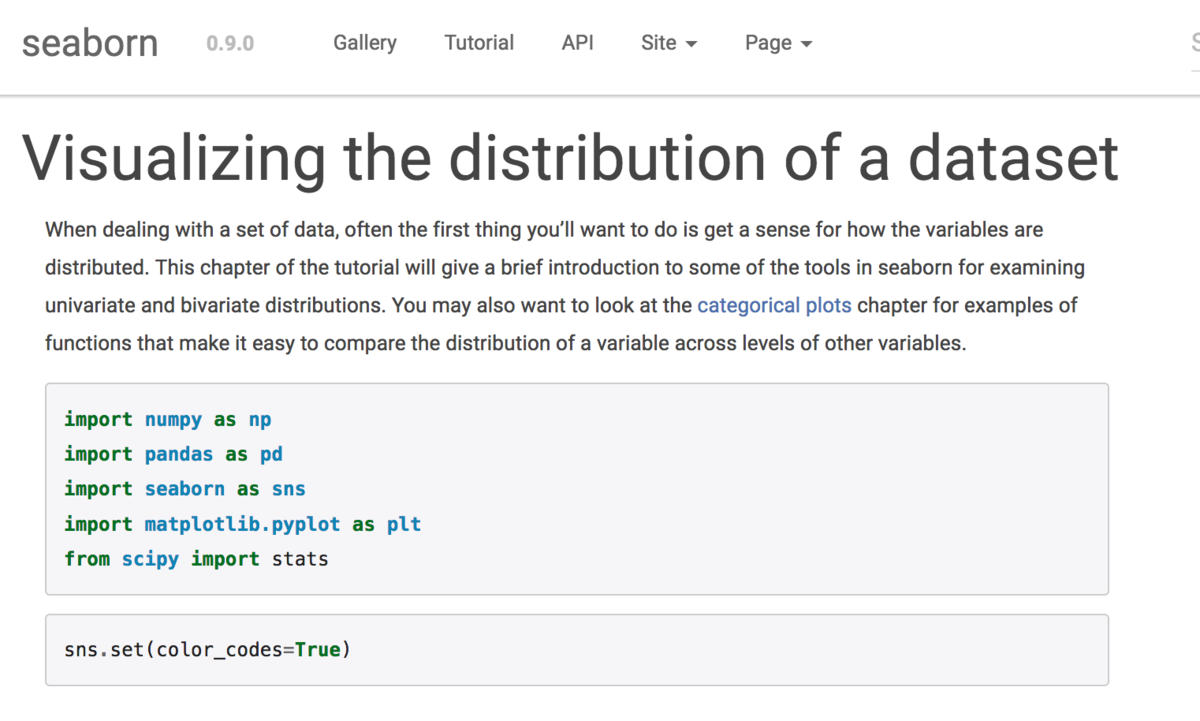
Visualizing the distribution of a dataset — seaborn 0.9.0 documentation
まずは簡単な概要をつかめればということで、冒頭のみ和訳します。
When dealing with a set of data, often the first thing you’ll want to do is get a sense for how the variables are distributed. This chapter of the tutorial will give a brief introduction to some of the tools in seaborn for examining univariate and bivariate distributions. You may also want to look at the categorical plots chapter for examples of functions that make it easy to compare the distribution of a variable across levels of other variables.
和訳:『データ集合を取り扱うにあたって、一番最初に知りたいのがどのように変数が分布しているか(distributed)です。チュートリアルのこの章を読むことで、単変数や二変数について知るためのseabornのツールの簡易的な導入を行うことができます。"categorical plots"の章も読むことで、変数間の分布の比較について参考になるかもしれません。』
冒頭部の説明より、1次元や2次元の変数に対して変数の分布を知るための機能を提供してくれているというのが読み取れます。大体の概要はつかめたので、下記のコードを実行して1-1の1変数の分布の描画に移りましょう。
import numpy as np
import pandas as pd
import seaborn as sns
import matplotlib.pyplot as plt
from scipy import statssns.set(color_codes=True)
1-1. Plotting univariate distributions
1-1では1変数のデータの分布の描画を行う"Plotting univariate distributions"についてまとめます。まずは下記を実行してみましょう。
np.random.seed(0)
x = np.random.normal(size=100)
sns.distplot(x);
実行結果は下記になります。
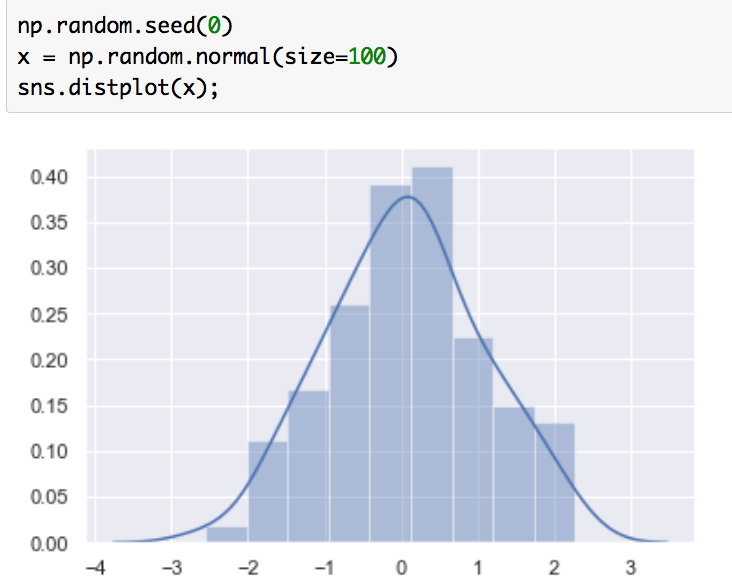
ヒストグラムとカーネル密度推定(KDE; Kernel Density Estimation)で推定した、確率密度関数(PDF; probability density function)が図示されています。サンプルコードにチュートリアルにないnp.random.seed(0)を追加したのは、乱数のシードを固定することで結果に再現性を持たせるためです。ヒストグラムだけを描画したい際は下記のようにすることでヒストグラムを描画できます。
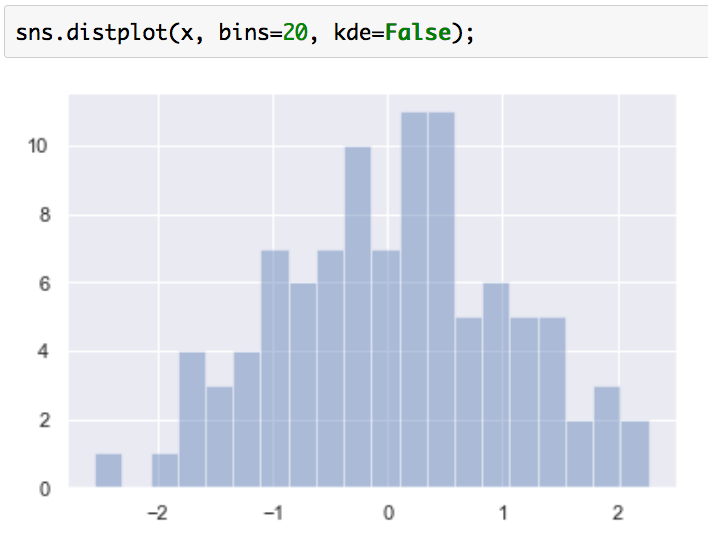
また、下記のようにすることで推定した確率密度関数のみを出力することもできます。
sns.distplot(x, hist=False);
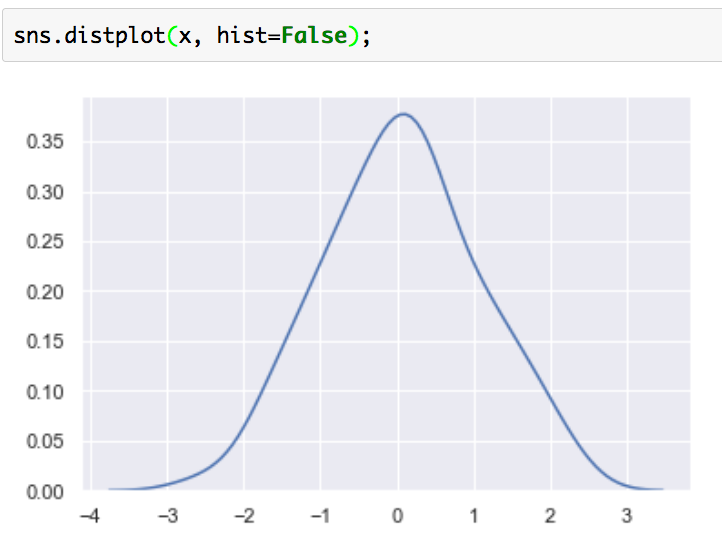
確率密度関数の推定についてはKDEを用いる以外にも、近しい確率分布を用いて近似する方法もあります。下記のようにすれば正規分布を用いて確率密度関数を計算することができます。
from scipy.stats import norm
np.random.seed(0)
x = norm.rvs(0, 1, size=200)
sns.distplot(x, fit=norm, kde=False);

このようにdistplotを用いることで、ヒストグラムや確率密度関数を描画することができます。
1-2. Plotting bivariate distributions
1-2では2変数のデータの分布の描画を行う"Plotting bivariate distributions"について取り扱います。まずは下記を実行してみましょう。
np.random.seed(0)
mean, cov = [0, 1], [(1, .5), (.5, 1)]
data = np.random.multivariate_normal(mean, cov, 200)
df = pd.DataFrame(data, columns=["x", "y"])sns.jointplot(x="x", y="y", data=df);
実行結果は下記のようになります。
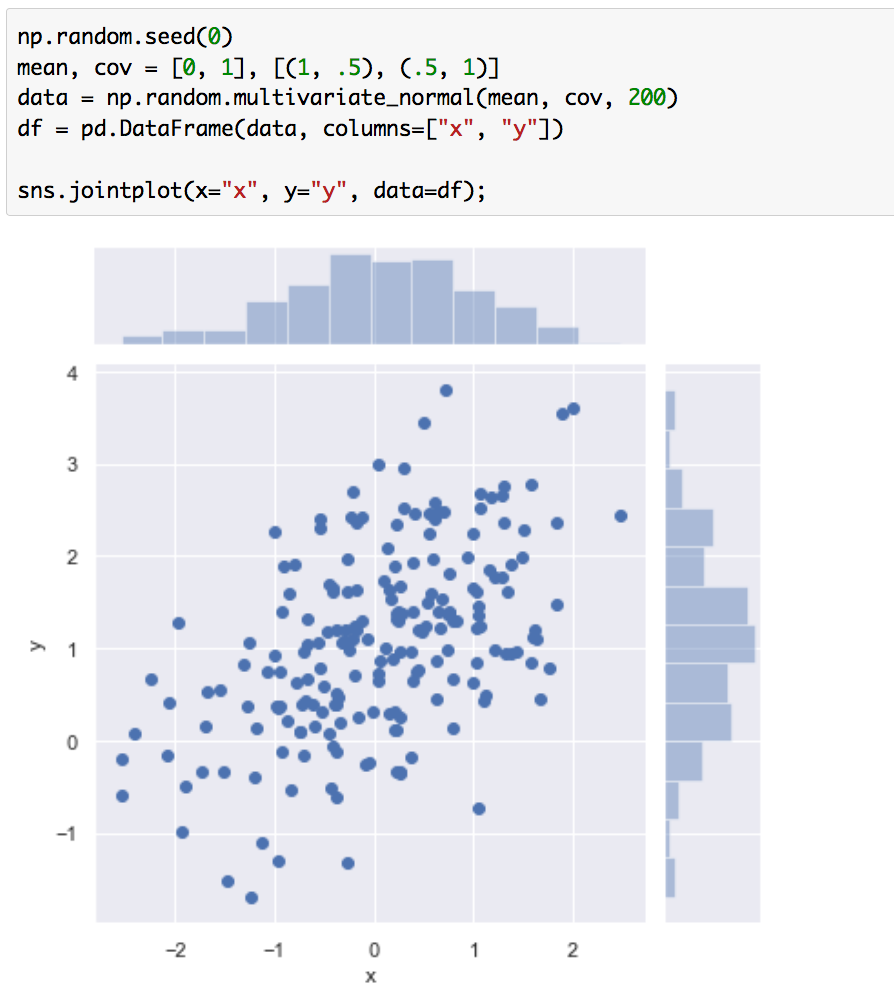
それぞれの変数のヒストグラムと散布図が可視化されています。また同様のデータにKDEを用いることで、二次元の確率分布を可視化することができます。
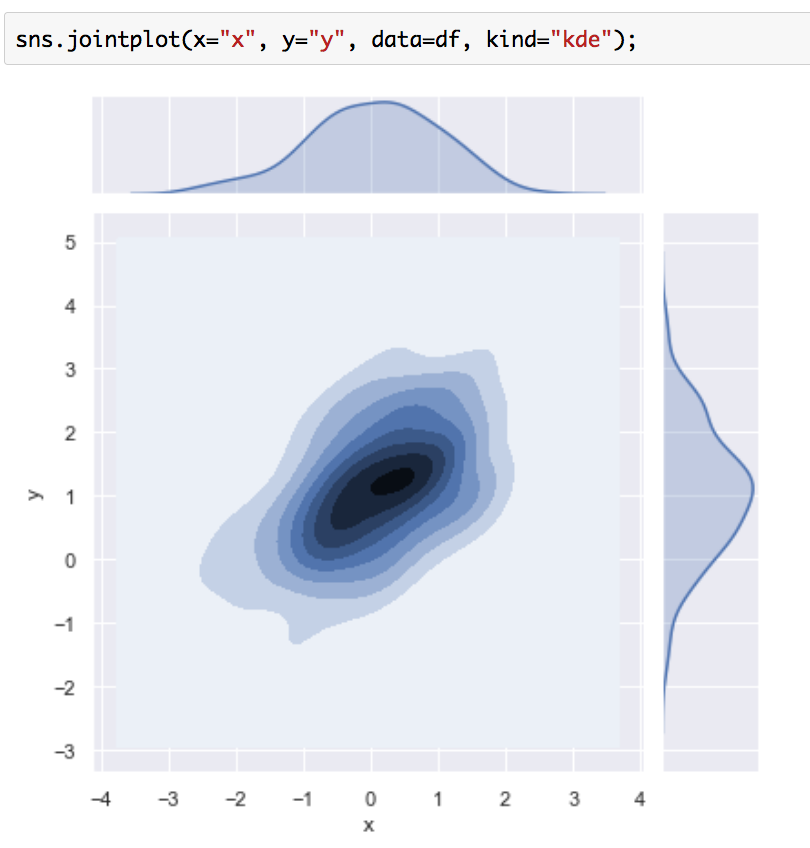
真ん中に推定した二次元の確率密度関数を表す等高線、上と右にそれぞれの周辺分布を表す確率密度関数が可視化されています。
2変数についてもこのように分布の可視化を行うことができます。
1-3. Visualizing pairwise relationships in a dataset
1-3ではデータセット内の二つの変数ペアの相関性の可視化を行う"Visualizing pairwise relationships in a dataset"について取り扱います。まずは下記を実行してみましょう。
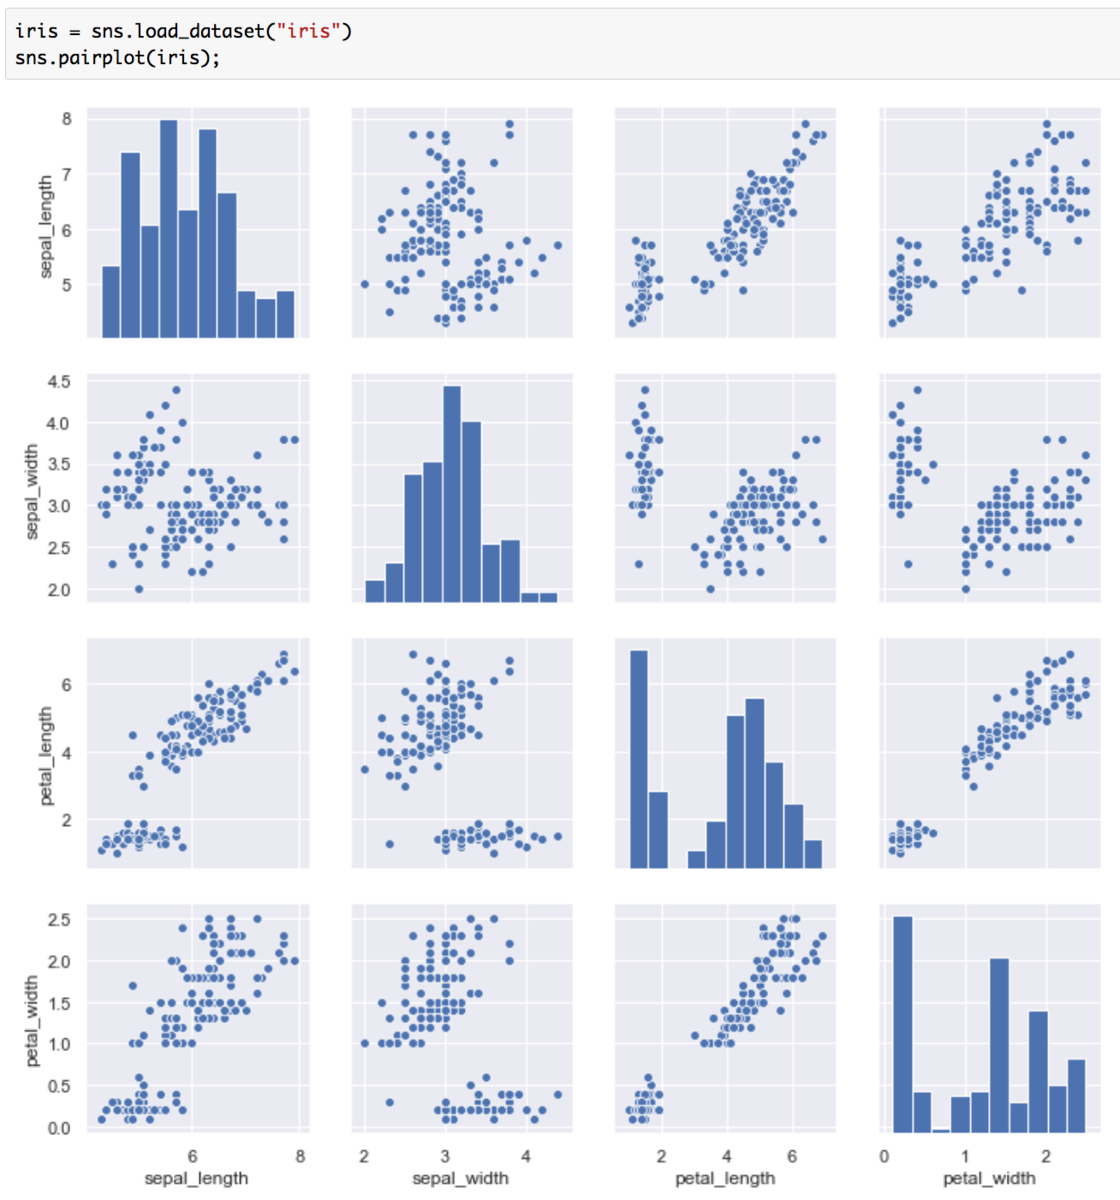
irisは4次元のデータセットですが、上記のようにsns.pairplotを用いることで4変数×4変数の可視化が行えています。対角に配置されているグラフはヒストグラム、対角以外に配置されているグラフは散布図を表しています。また下記のようにすることで、カーネル密度推定をそれぞれの変数の組について行うことができます。
g = sns.PairGrid(iris)
g.map_diag(sns.kdeplot)
g.map_offdiag(sns.kdeplot, n_levels=6);
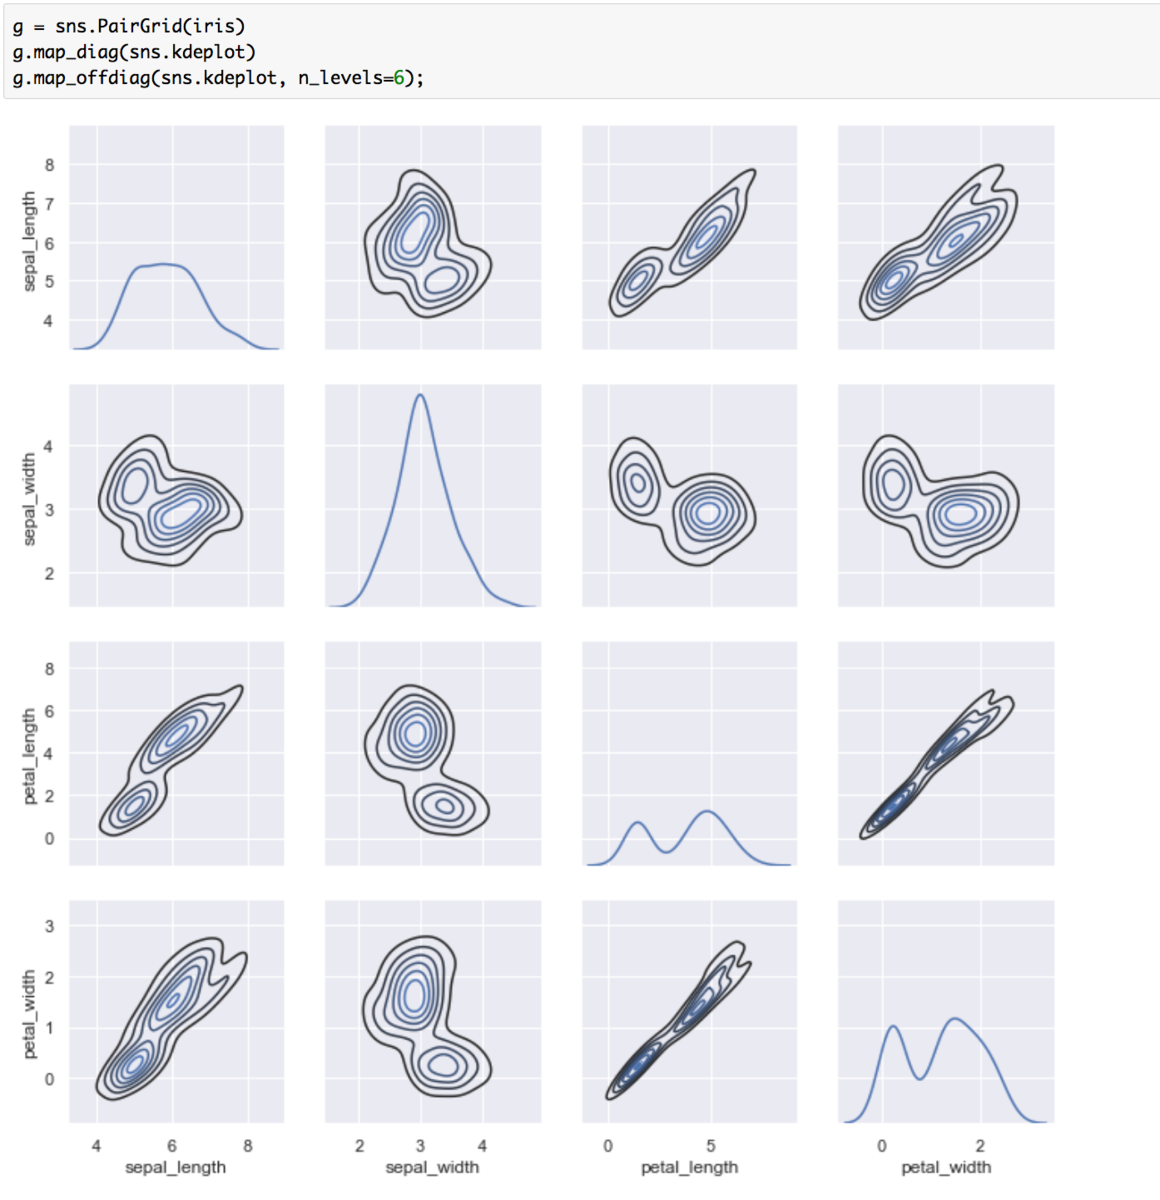
このように、データセットを入力するだけでそれぞれの変数間の関係性をまとめてグラフ化してくれるので非常に便利です。
2. まとめ
#7では変数の分布を知るにあたって"Visualizing the distribution of a dataset"について取り扱いました。
#8では引き続き"Visualizing linear relationships"について取り扱います。