Tutorialに学ぶseabornの使い方②(Plotting with categorical data)|Pythonによる可視化入門 #6

連載の経緯は#1をご確認ください。
#1〜#4まではMatplotlibに関して、#5ではseabornの概要と、チュートリアルの"Visualizing statistical relationships"を元に使い方についてまとめました。
#6では#5に引き続きseabornのチュートリアルから"Plotting with categorical data"について取り扱います。
以下目次になります。
1. Plotting with categorical dataについて
1-1. Categorical scatterplots
1-2. Distributions of observations within categories
1-3. Statistical estimation within categories
1-4. Plotting “wide-form” data(省略)
1-5. Showing multiple relationships with facets(省略)
2. まとめ
1. Plotting with categorical dataについて
1節ではチュートリアルの"Plotting with categorical data"について取り扱っていきます。

Plotting with categorical data — seaborn 0.9.0 documentation
まずは簡単な概要をつかめればということで、冒頭のみ和訳します。
In the relational plot tutorial we saw how to use different visual representations to show the relationship between multiple variables in a dataset. In the examples, we focused on cases where the main relationship was between two numerical variables. If one of the main variables is “categorical” (divided into discrete groups) it may be helpful to use a more specialized approach to visualization.
和訳:『"relational plot tutorial"では、データセットにおける多変量間の相関性について可視化するにあたって様々な視覚表現について確認してきました。サンプルコードにおいては2つの数値的なメイン変数間の相関を見ることにフォーカスをあてました。片方のメインの変数がカテゴリカル(離散的な変数の一種)だとすると、可視化にあたってより特化したアプローチを考えることができます。』
上記より、このチュートリアルページのメインテーマが、カテゴリカル変数の可視化にあることがわかります。説明が長くなると逆にわかりづらくなるので、詳細は1-1〜1-5で取り扱うとして、下記のコードの実行だけ行っていただき1-1節に移れればと思います。
import seaborn as sns
import matplotlib.pyplot as plt
sns.set(style="ticks", color_codes=True)
1-1. Categorical scatterplots
1-1ではカテゴリカル変数の散布図の作成を行う、"Categorical scatterplots"について取り扱います。まずは下記を実行してみましょう。
tips = sns.load_dataset("tips")
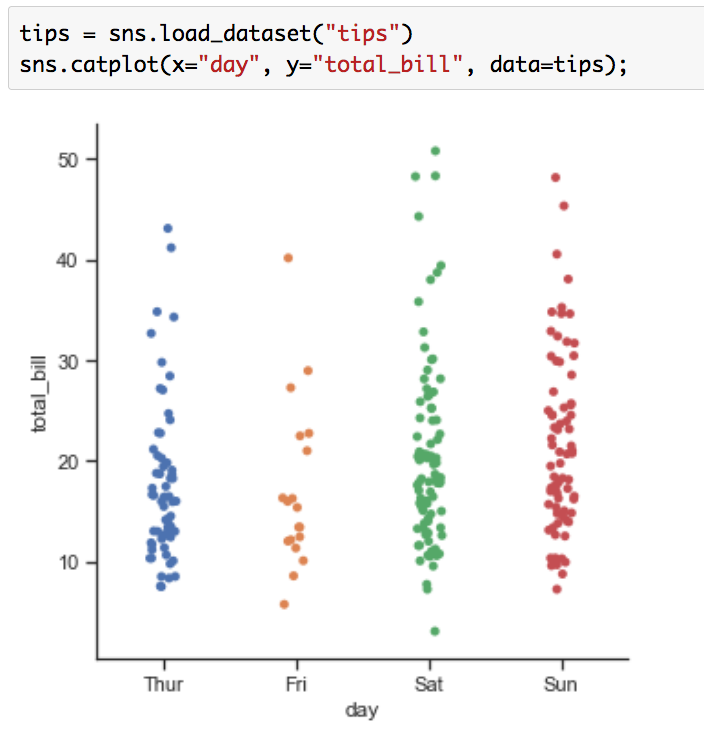
sns.catplot(x="day", y="total_bill", data=tips);
実行結果は下記のようになります。

通常の散布図であれば点を打つだけで良いものの、カテゴリカル変数の散布図については同じポイントの点の数を判断するのが難しいという問題がありますが、上図ではランダムのノイズ(random “jitter”)を加えることで同じ値の点の数も可視化できるようにされています。オプションjitterをFalseにすることで下記のようにすることもできますが、これだとやはりサンプルの数を判断するのが難しくなっています。

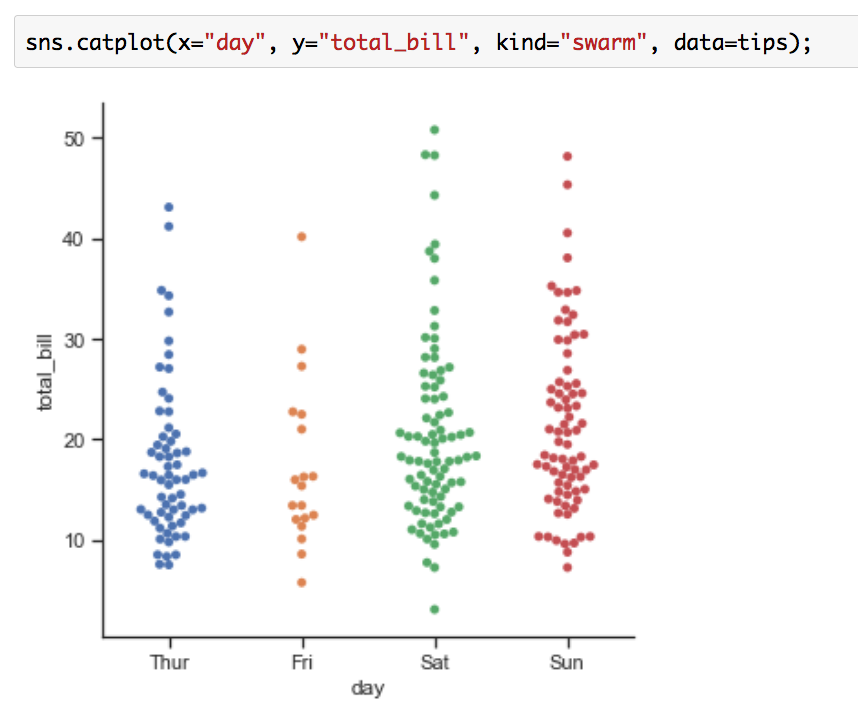
可視化にあたってのもう一つのアプローチとしては、"beeswarm"もあります。beeswarmはkind="swarm"を引数として与えることで実施することができます。可視化は下記のように行うことができます。
sns.catplot(x="day", y="total_bill", kind="swarm", data=tips);

このようにランダムノイズやbeeswarmを用いることで、カテゴリカル変数の散布図を描くことができます。
1-2. Distributions of observations within categories
1-2ではカテゴリカル変数の分布の作成を行う"Distributions of observations within categories"について取り扱います。可視化の目的は1-1と同じなのですが、アプローチが違うという認識が良いかと思います。まずは下記を実行してみましょう。
sns.catplot(x="day", y="total_bill", kind="box", data=tips);

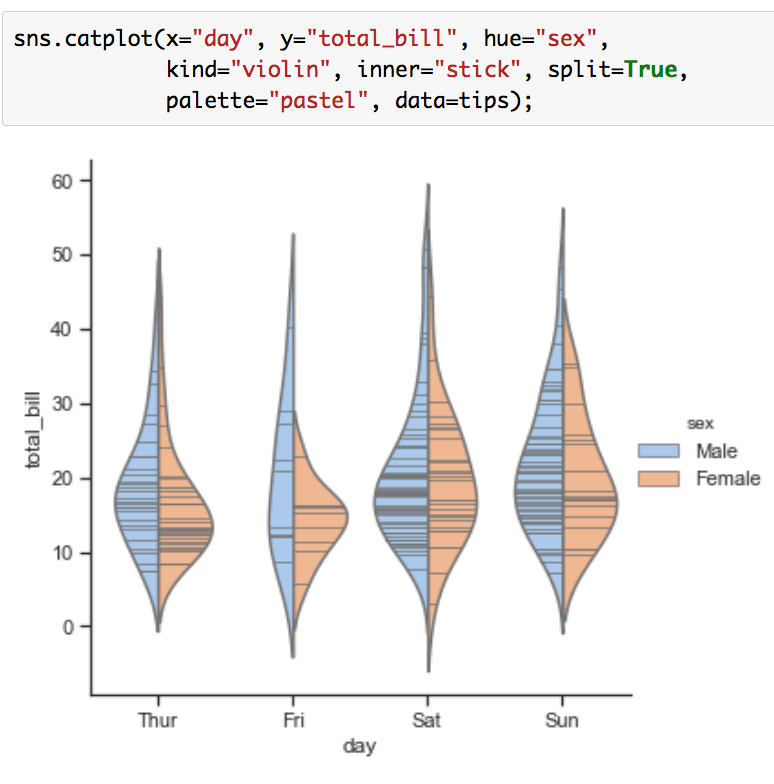
上記ではkindに"box"を与えることで箱ひげ図(Boxplots)が描画されています。箱ひげ図以外にもkindに"violin"を与えることで、Violinplotsの作成を行うことができます。
sns.catplot(x="day", y="total_bill", hue="sex",
kind="violin", inner="stick", split=True,
palette="pastel", data=tips);

このように、分布を用いてカテゴリカル変数の可視化を行うことができます。
1-3. Statistical estimation within categories
1-3では統計的な推定についての描画を行う"Statistical estimation within categories"について取り扱います。まずは下記を実行してみましょう。
titanic = sns.load_dataset("titanic")
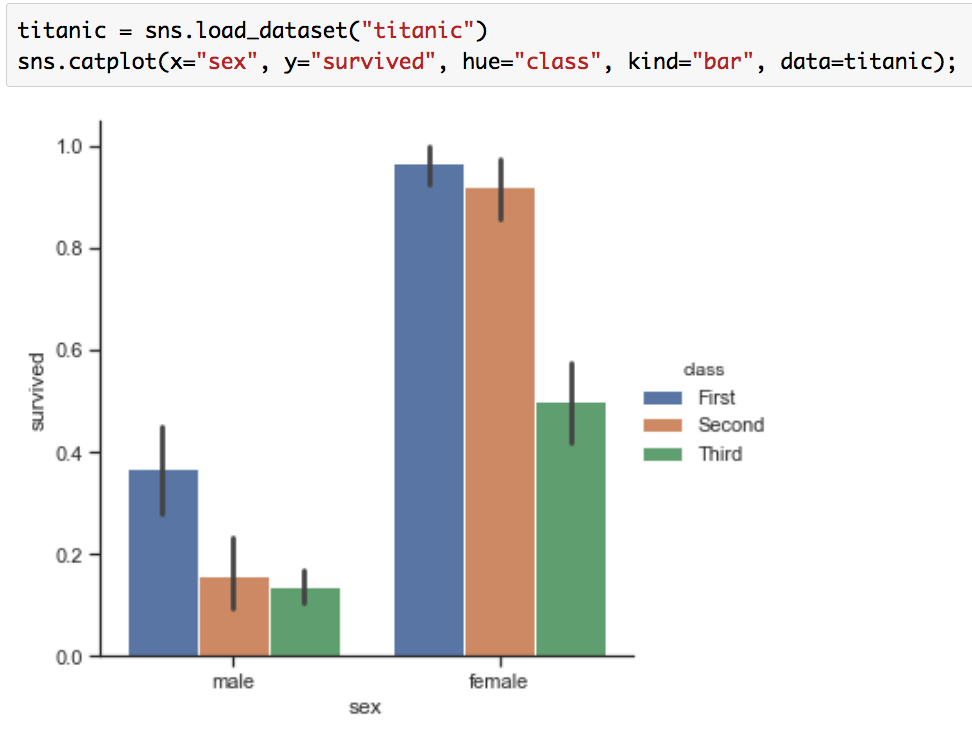
sns.catplot(x="sex", y="survived", hue="class", kind="bar", data=titanic);

データセットのTitanicはタイタニック号の乗客生存を表した有名なデータセットです。簡単に概要を確認すると下記のようになります。
print(type(titanic))
print(titanic.shape)
print(titanic.head())

確認すると、グラフのy軸の入力として与えているsurvivedは0/1の2値データとなっていることがわかります。kind="bar"とすることで、それぞれの生存確率の可視化を行っています。また、下記のようにすることでヒストグラムも描画することができます。
sns.catplot(x="deck", kind="count", palette="ch:.25", data=titanic);

このように、様々な統計的な推定量の可視化を行うことができます。
1-4. Plotting “wide-form” data
必要があれば後日追記します。
1-5. Showing multiple relationships with facets
必要があれば後日追記します。
2. まとめ
#6では"Plotting with categorical data"について取り扱いました。情報量が豊富なので、ところどころ飛ばしたり、1-4と1-5は省略しましたが、一通り基本的な内容については抑えられたかと思います。
#7では"isualizing the distribution of a dataset"について取り扱えればと思います。