Matplotlibの使い方④(plt.subplots、plt.title、plt.legend)|Pythonによる可視化入門 #4

#1では連載の経緯と、よく使う可視化機能であるmatplotlib.pyplotより、plt.plot、plt.scatter、plt.histについてまとめました。
また、#2では"Sample plots in Matplotlib"より、plt.bar、plt.pie、plt.hist2dについて、#3では少々発展的なグラフの描画として、plt.streamplot、plt.fill、plt.polarをご紹介しました。
#4ではグラフの描画にあたって知っておきたい内容として、plt.subplots、plt.title、plt.legendについて取り扱います。
以下目次になります。
1. グラフの描画にあたって知っておきたい機能(plt.subplots、plt.title、plt.legend)
1-1. plt.subplotsを用いた複数グラフの描画
1-2. plt.title、plt.xlabel、plt.ylabelを用いたタイトルや軸のラベル付け
1-3. plt.legendを用いた説明書き(凡例)の追加
2. まとめ
1. グラフの描画にあたって知っておきたい機能(plt.subplots、plt.title、plt.legend)
#4はグラフをカスタマイズしていくにあたって知っておきたい機能として、plt.subplots、plt.title、plt.legendなどについて取り扱っていきます。
1-1. plt.subplotsを用いた複数グラフの描画
1-1ではplt.subplotsを用いて複数グラフの描画を行っていきます。

Sample plots in Matplotlib — Matplotlib 3.1.0 documentation
plt.subplotsは上記のページでも最下部で触れられています。説明から入ると大変なので、まずはコードを先に動かします。下記のコードを実行して見てください。
import matplotlib.pyplot as plt
import numpy as npnp.random.seed(19680801)
data = np.random.randn(2, 100)fig, axs = plt.subplots(2, 2, figsize=(5, 5))
axs[0, 0].hist(data[0])
axs[1, 0].scatter(data[0], data[1])
axs[0, 1].plot(data[0], data[1])
axs[1, 1].hist2d(data[0], data[1])plt.show()
結果は下記のようになります。

4つのグラフを同時に出力できていることがわかります。axsのインデックスで図表を管理していそうというのがここから読み取れます。とはいえこれだけだと使いこなすまで至らないため、plt.subplotsのドキュメントを確認していきましょう。

(中略)

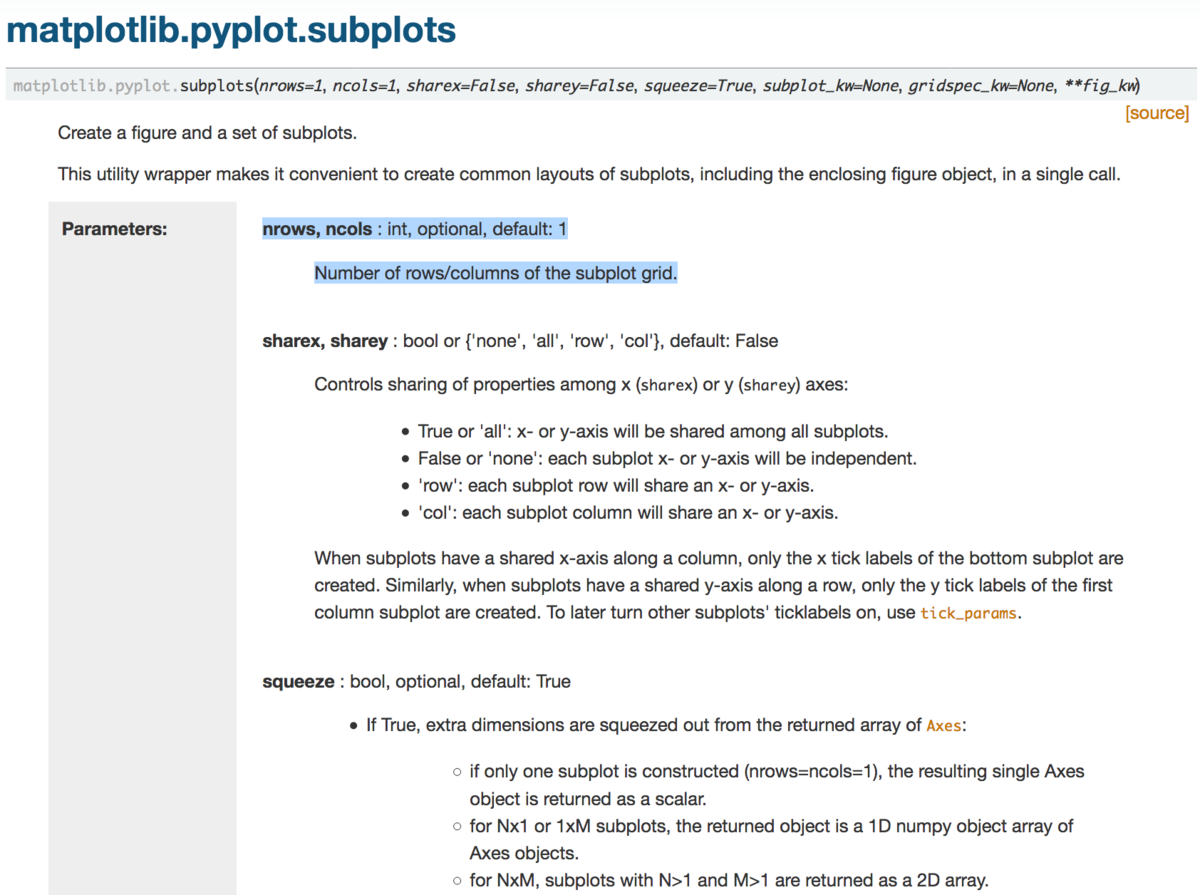
上記を確認する際にまず気になるのが値指定が必須の引数です。必須の引数としてはnrowsとncolsで、"Number of rows/columns of the subplot grid."とあるので、サブプロットグリッド(描画するグラフを格子状に配置したもの)の行数と列数を表すとあります。次に気になるのが返り値です。二つ目の返り値を用いてグラフを描画しているので、axに着目しましょう。AxesオブジェクトもしくはAxesオブジェクトの配列を生成しているとあるのですが、深入りすると大変そうなので、一旦Axesオブジェクトというものがあるという認識にしておきます。
例が二つある方が比較できて良いので、もう一例ご紹介します。
Plotting categorical variables — Matplotlib 3.1.0 documentation
より、サンプルコードを拝借します。
import matplotlib.pyplot as plt
data = {'apples': 10, 'oranges': 15, 'lemons': 5, 'limes': 20}
names = list(data.keys())
values = list(data.values())fig, axs = plt.subplots(1, 3, figsize=(9, 3), sharey=True)
axs[0].bar(names, values)
axs[1].scatter(names, values)
axs[2].plot(names, values)
fig.suptitle('Categorical Plotting')
上記の実行結果は下記になります。

1行3列でグラフが描画できていることが上記より確認できます。
このようにplt.subplotsを用いることで、複数グラフの描画を行うことができます。
1-2. plt.title、plt.xlabel、plt.ylabelを用いたタイトルや軸のラベル付け
1-2ではタイトルや軸のラベル付けを行うにあたって、plt.title、plt.xlabel、plt.ylabelをご紹介します。

Usage Guide — Matplotlib 3.1.0 documentation
まずは上記のコードを動かしてみます。
import numpy as np
import matplotlib.pyplot as pltx = np.linspace(0, 2, 100)
plt.plot(x, x, label='linear')
plt.plot(x, x**2, label='quadratic')
plt.plot(x, x**3, label='cubic')plt.xlabel('x label')
plt.ylabel('y label')plt.title("Simple Plot")
plt.legend()
plt.show()
上記の実行結果は下記のようになります。

実行結果とソースを見比べると、plt.xlabelでx軸のラベル、plt.ylabelでy軸のラベル、plt.titleで図表のタイトルを記述しているということがわかります。
挙動を確認するにあたって、少しだけそれぞれ修正を行ってみます。
import numpy as np
import matplotlib.pyplot as pltx = np.linspace(0, 2, 100)
plt.plot(x, x, label='linear')
plt.plot(x, x**2, label='quadratic')
plt.plot(x, x**3, label='cubic')plt.xlabel('x label modified')
plt.ylabel('y label modified')plt.title("Simple Plot(modified title)")
plt.legend()
plt.show()
実行結果は下記のようになります。

それぞれの変更が反映されていることが確認できます。
1-3. plt.legendを用いた説明書き(凡例)の追加
1-2の例でplt.legendも出ていたので、同じ例を用いて解説を行います。まずはplt.legend()をコメントアウトして実行してみましょう。
import numpy as np
import matplotlib.pyplot as pltx = np.linspace(0, 2, 100)
plt.plot(x, x, label='linear')
plt.plot(x, x**2, label='quadratic')
plt.plot(x, x**3, label='cubic')plt.xlabel('x label')
plt.ylabel('y label')plt.title("Simple Plot")
#plt.legend()
plt.show()
実行結果は下記のようになります。

1-2で出ていたグラフに関する注釈が消えていることがわかります。

matplotlib.pyplot.legend — Matplotlib 3.1.0 documentation
上記で簡単な言及がされているのですが、ドキュメントのコードと概ね同様の記述がされているようです。
もう一例ある方が良さそうなので例をもう一つ追加させていただきます。
import numpy as np
import matplotlib.pyplot as pltx = np.linspace(0, 2, 100)
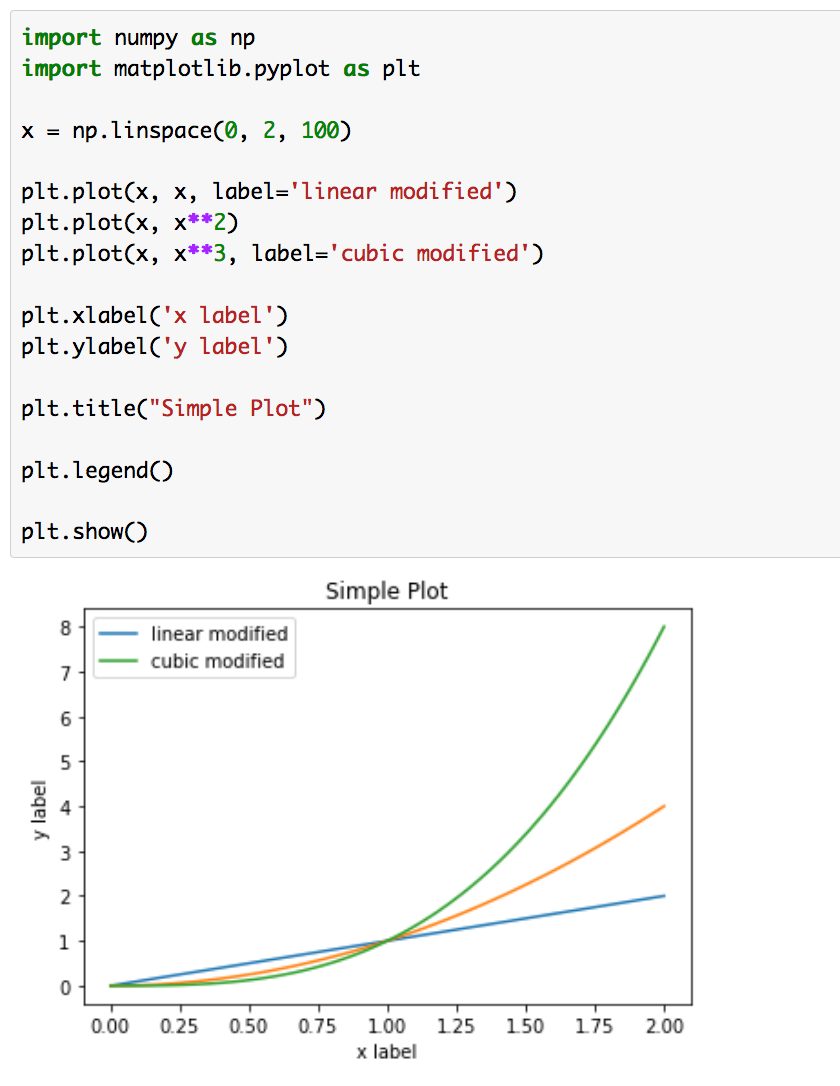
plt.plot(x, x, label='linear modified')
plt.plot(x, x**2)
plt.plot(x, x**3, label='cubic modified')plt.xlabel('x label')
plt.ylabel('y label')plt.title("Simple Plot")
plt.legend()
plt.show()
実行結果は下記のようになります。

と
のグラフの凡例は変更され、
のグラフの凡例は消去されていることが確認できます。
2. まとめ
#4ではグラフのカスタマイズにあたって知っておきたい内容として、plt.subplots、plt.title、plt.legendについて取り扱いました。
ここまでで、Matplotlibの大まかな使い方は把握ができたので、#5では他の描画ライブラリとしてseabornについて取り扱っていきます。